OpenSource Air Quality Monitoring with Prometheus and Airgradient
So, a while back I was looking for an air quality (AQ) monitor with an API so I can monitor the air in my office. I came across Airgradient, who were building Open Source Hardware for AQ monitoring. I ordered it in August and received it in about 3 weeks without having to pay any customs.
Version 1
I then set about writing a Prometheus exporter for it. The monitor comes with the ability to send the AQ data to the Airgradient cloud service, and the firmware is open-source. I made a quick and dirty change to send the JSON over to a local endpoint which I then converted to Prometheus metrics and exposed them.
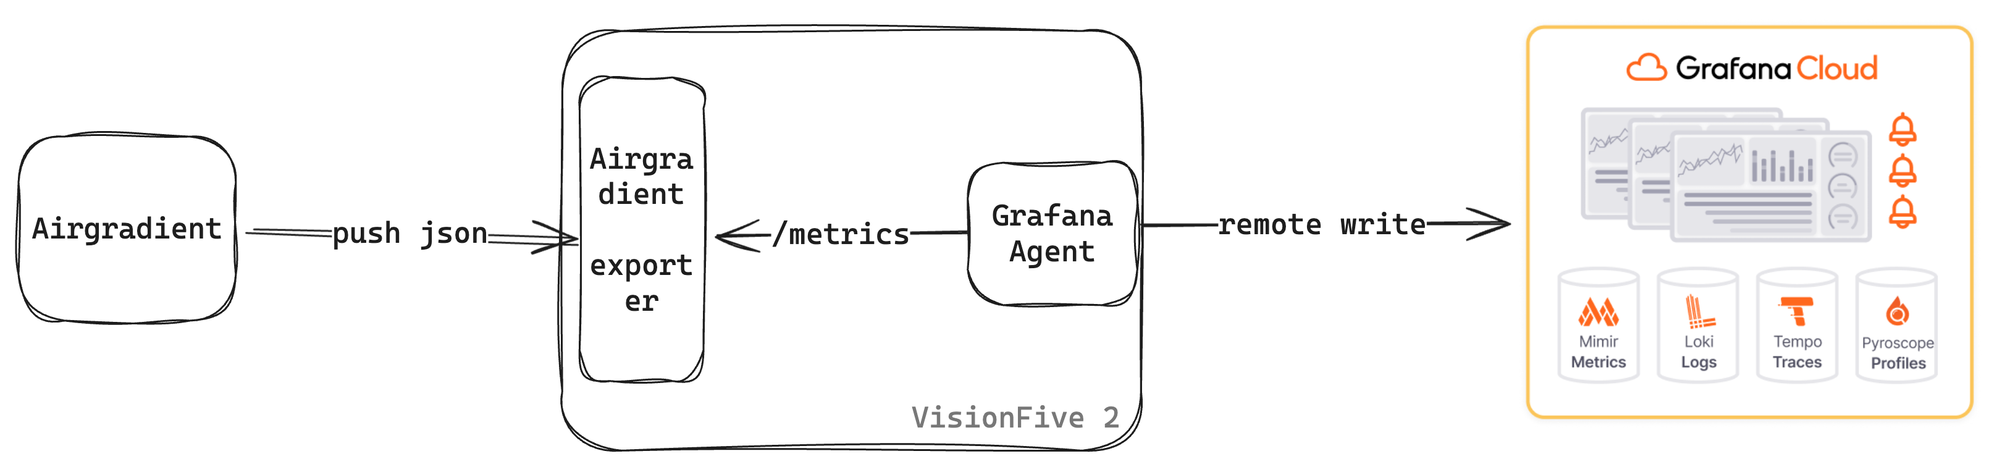
It was a very simple exporter that I was running on a VisionFive 2 RISC-V board . The architecture looked liked this:
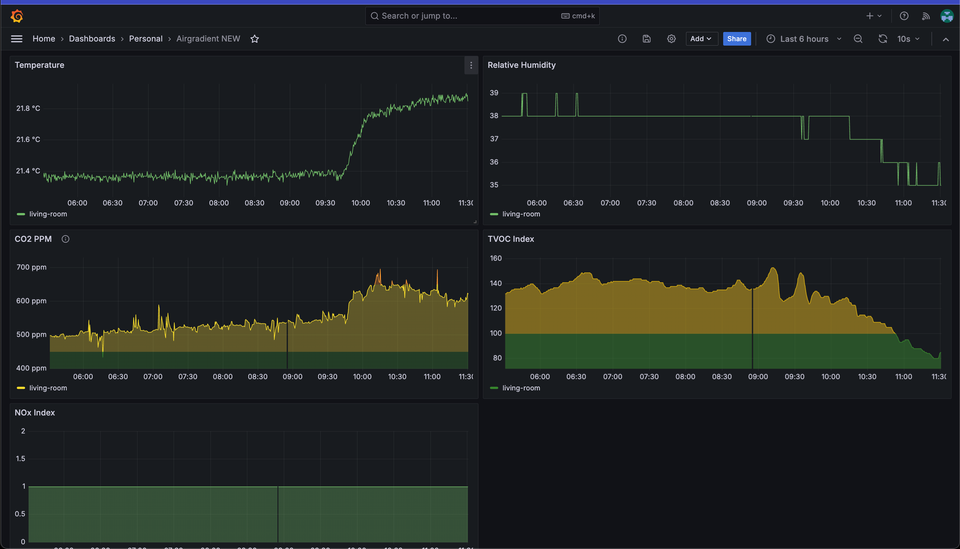
It worked beautifully and I have over 5 months of data in my Grafana Cloud that you can also explore 😄
btw, Grafana Cloud has a free tier with 10K metrics, and given each monitor produces 14 metrics, which means you can monitor over 700 devices before you need to put in a credit card 😏
Version 2
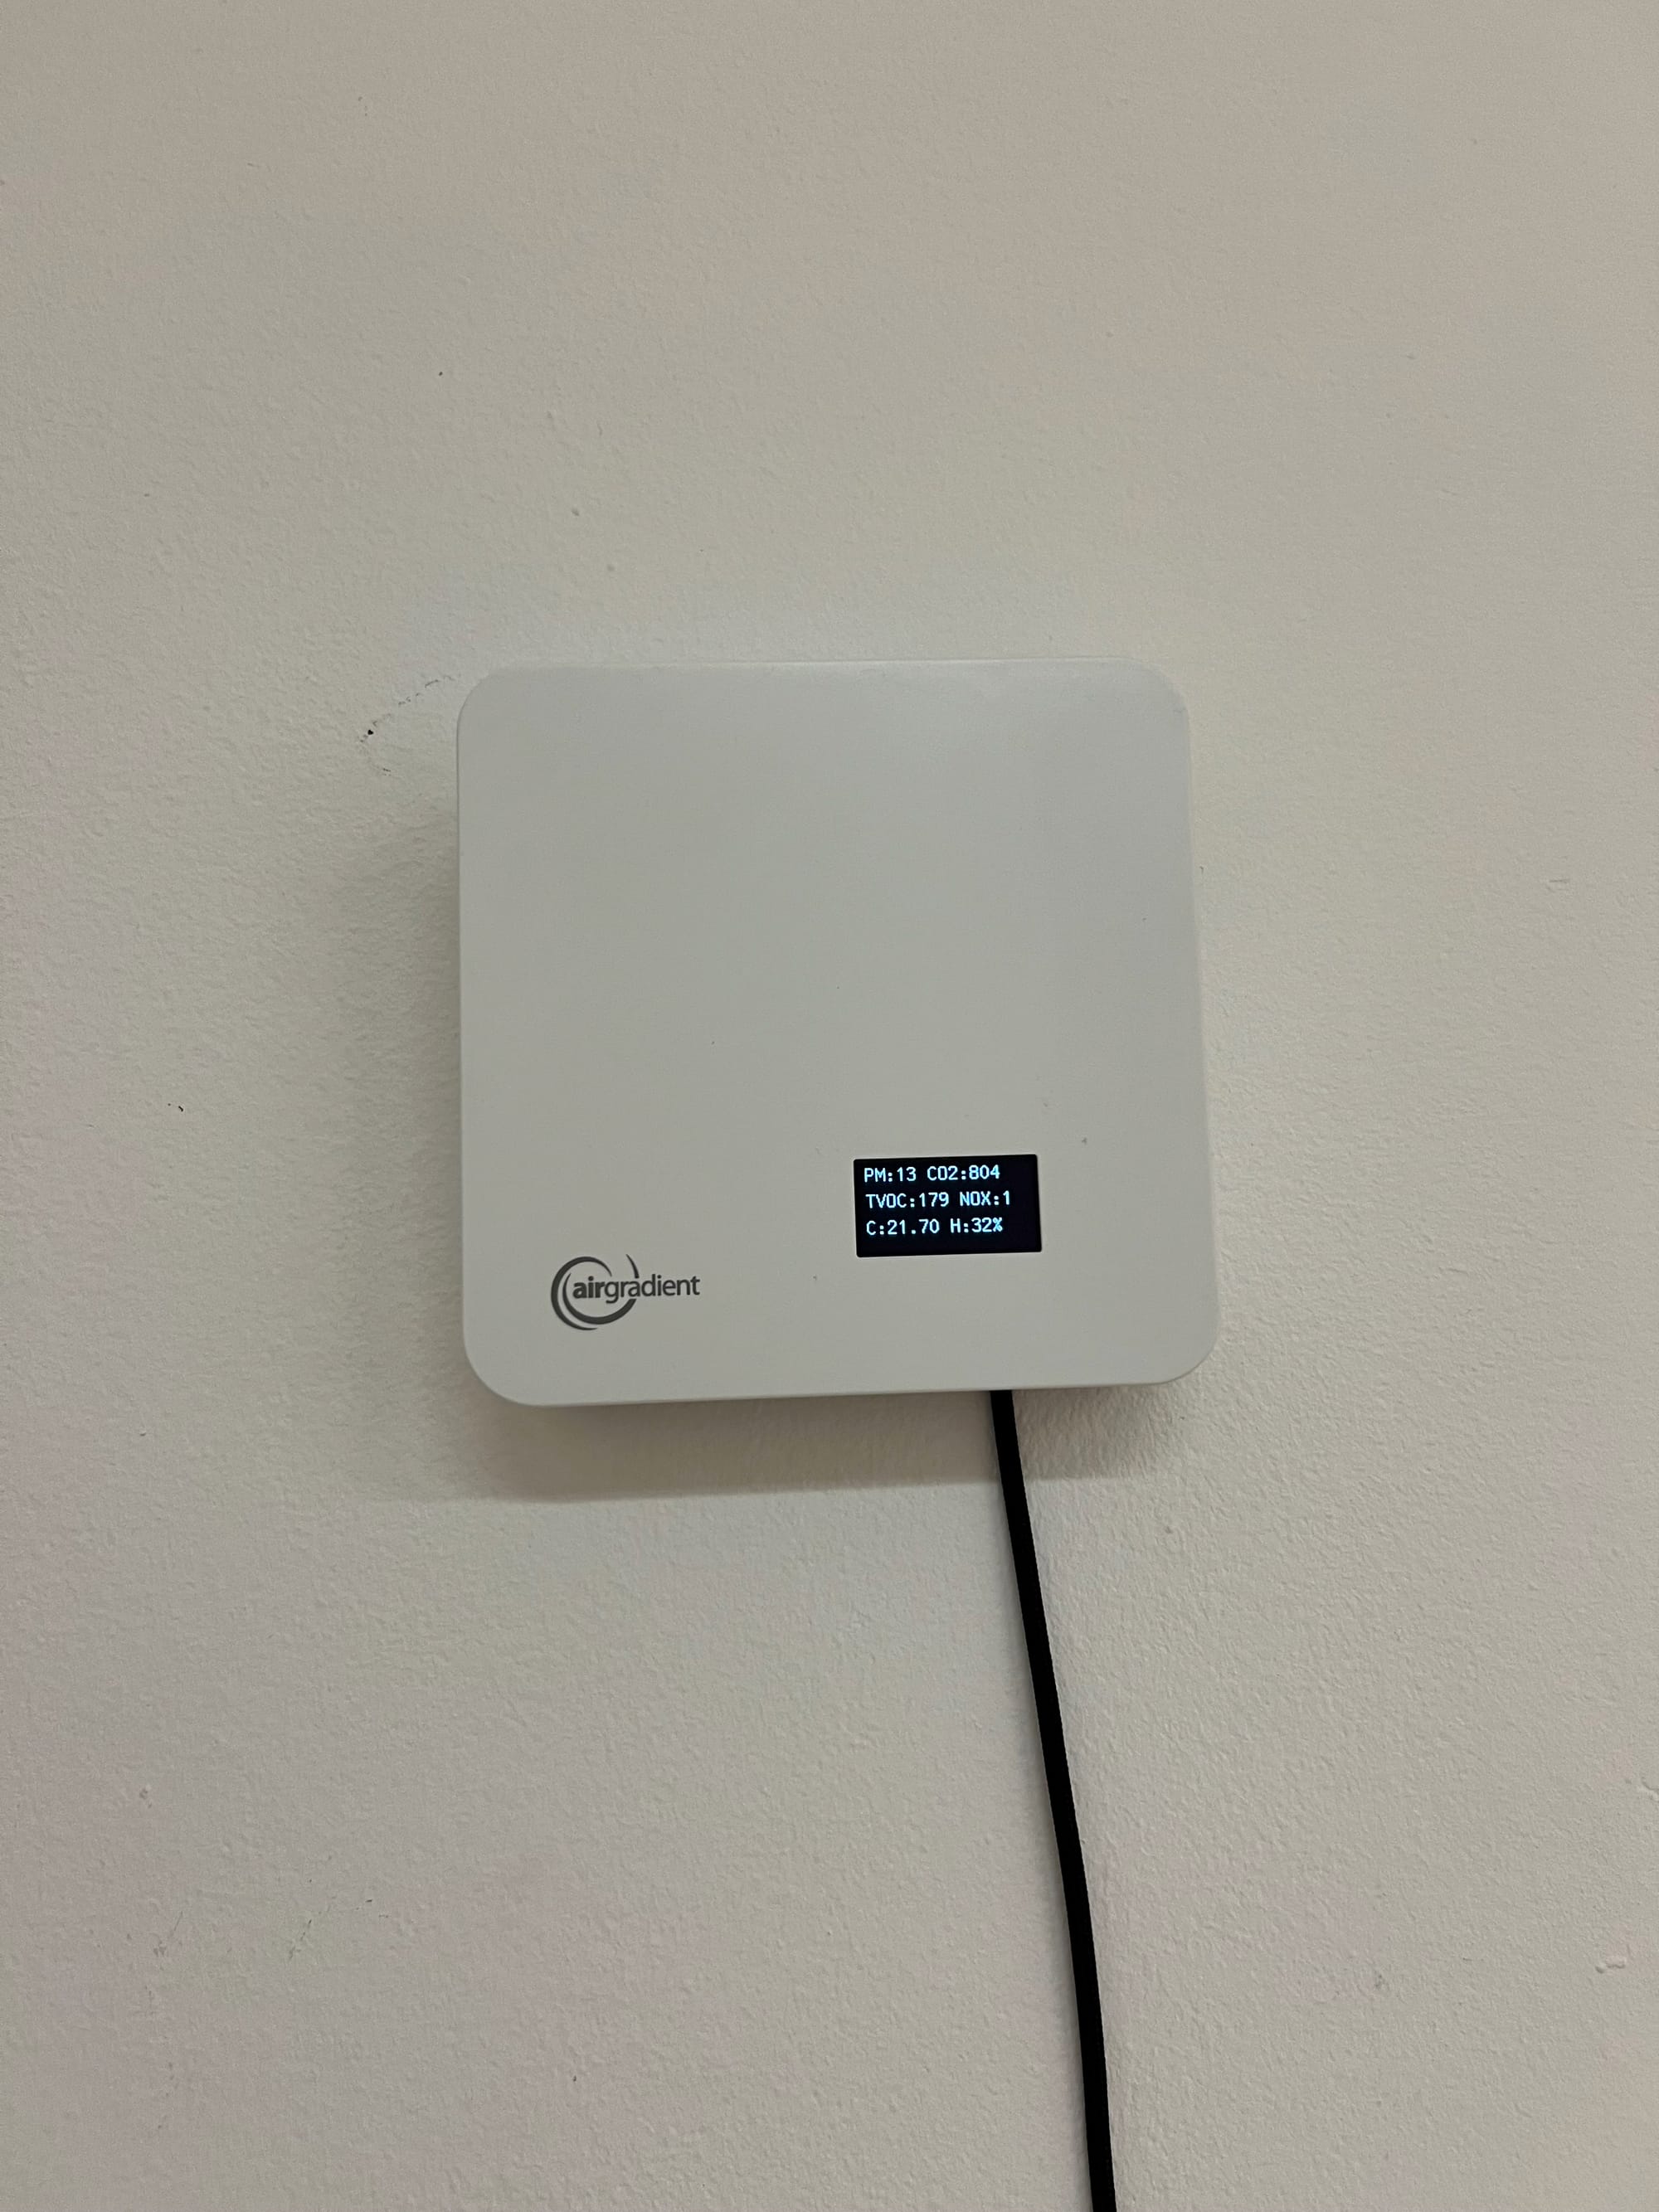
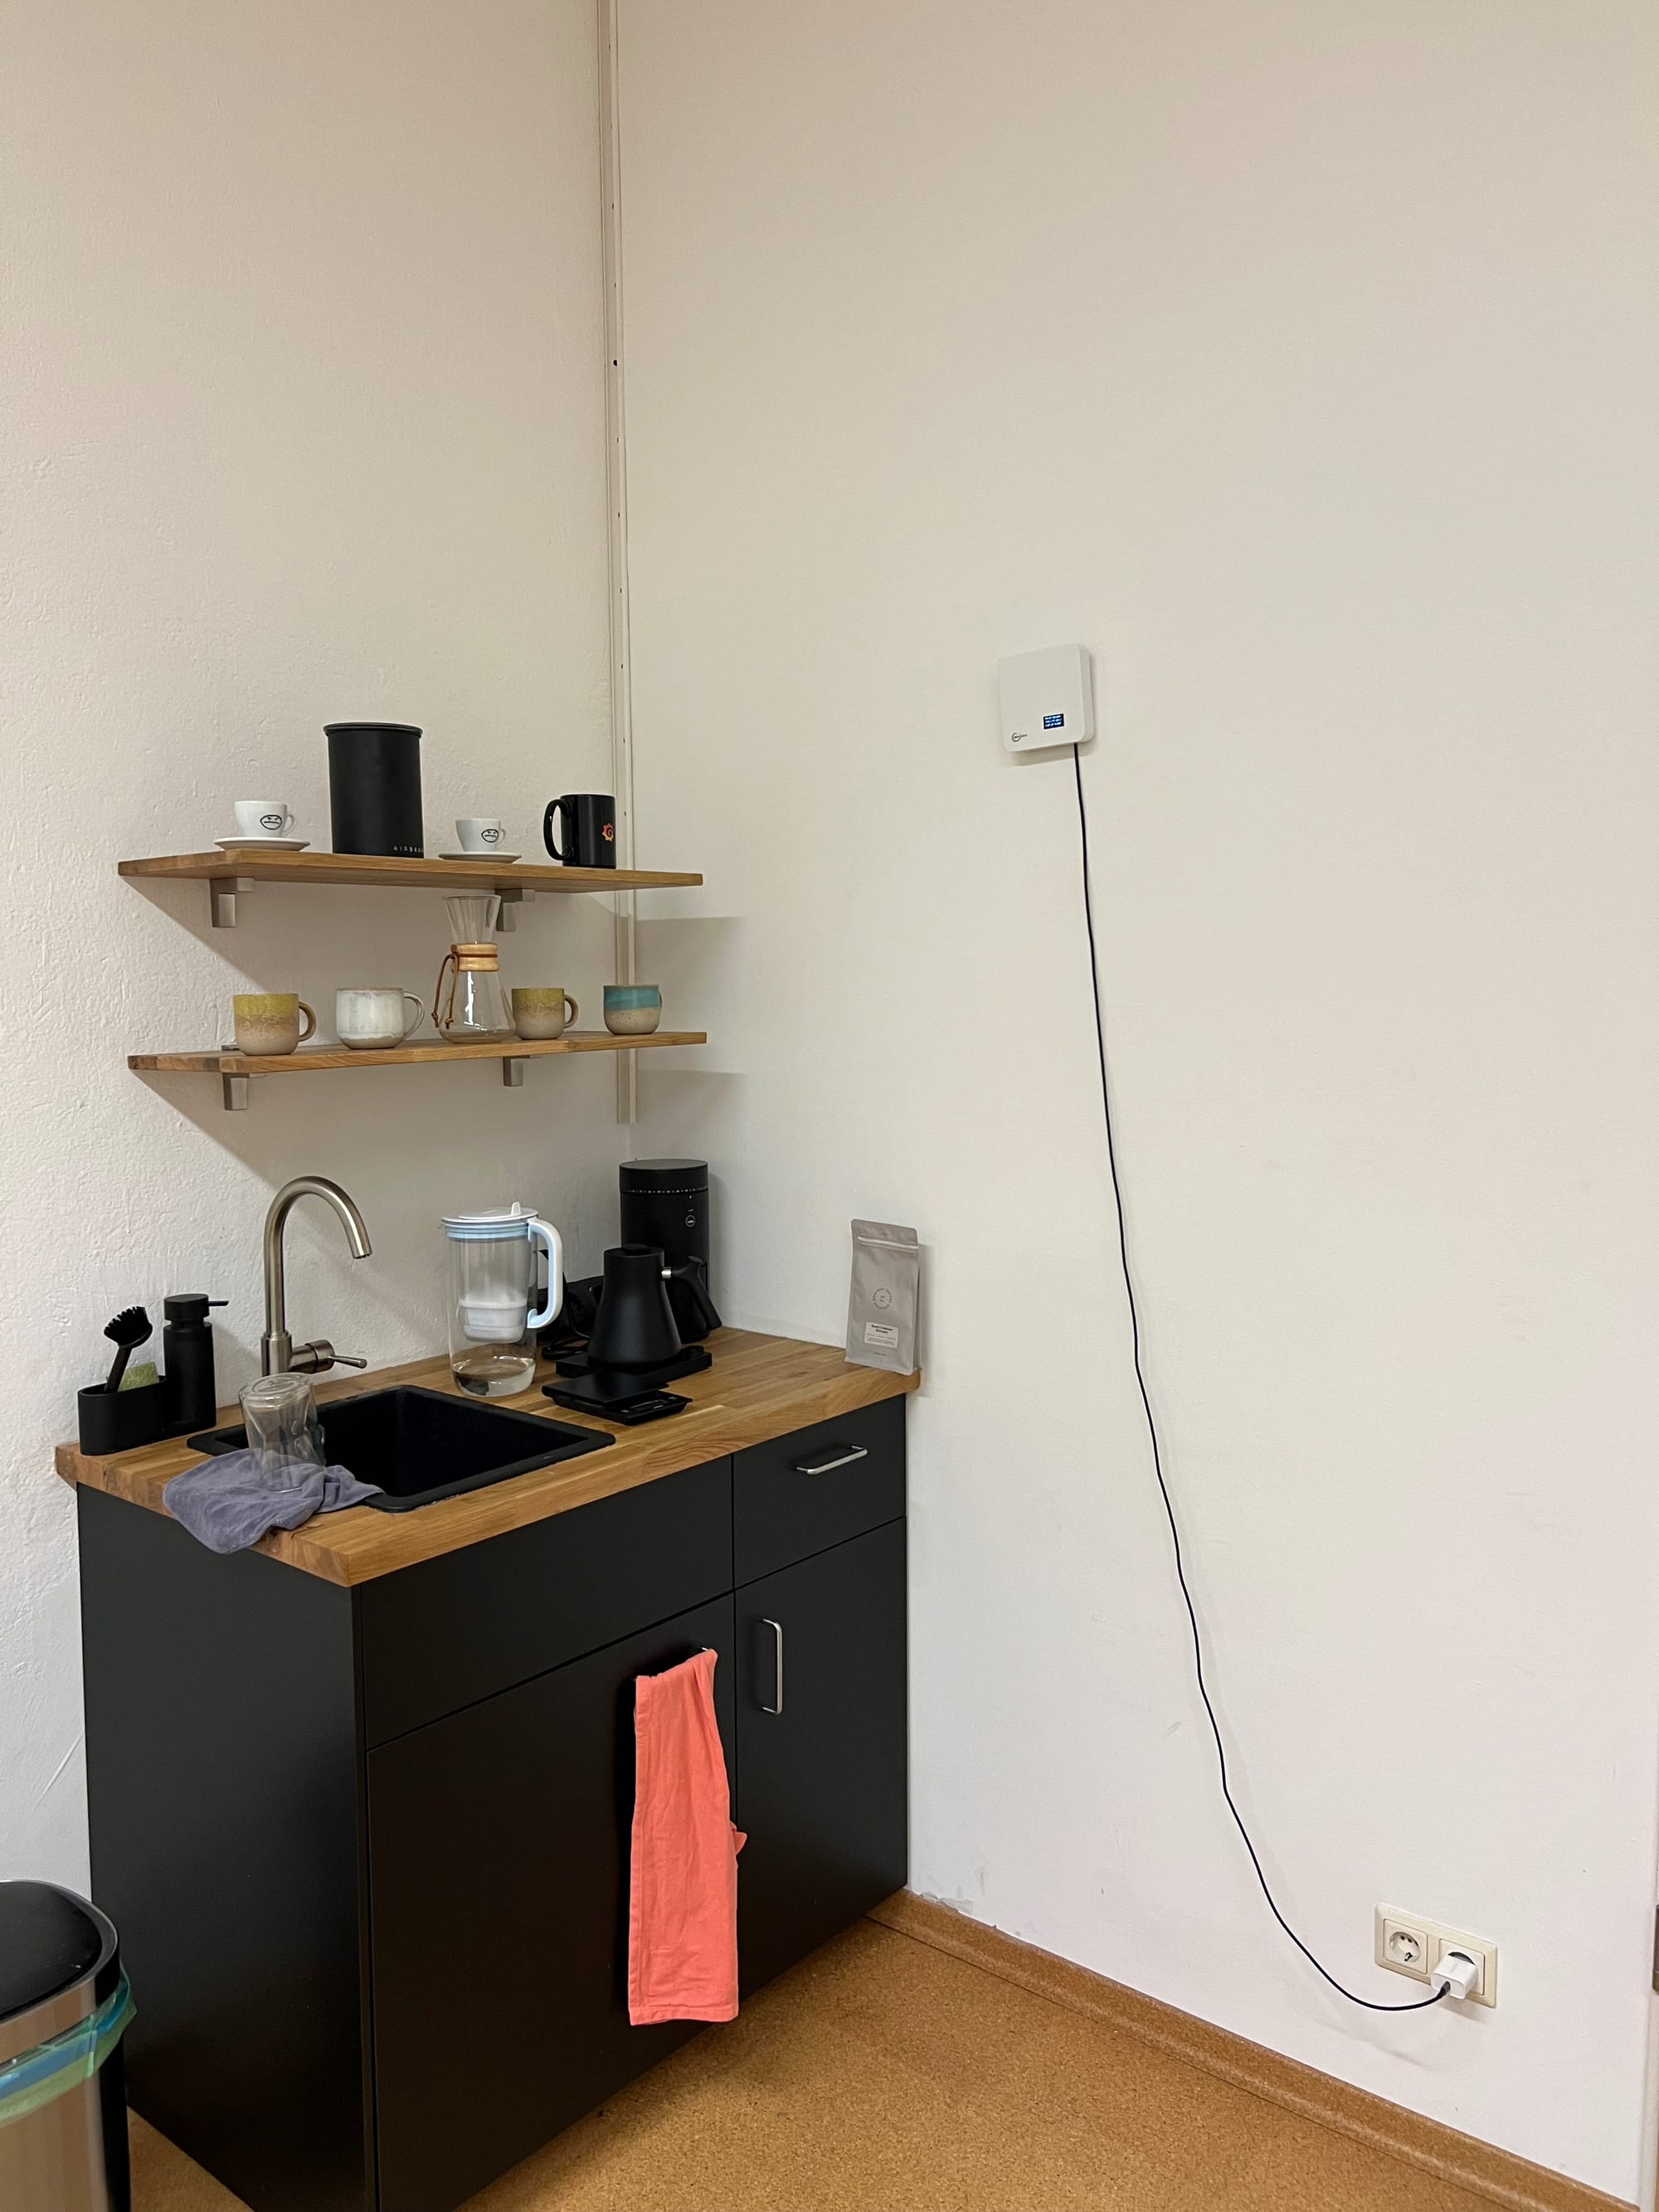
I liked it enough that I ordered a couple more recently for use at home (living room & bedroom). And this time I got something that looked almost the same, but it was a new upgraded version with a new MCU and an OLED display.
I only realised it when I went looking for the firmware and found that it was quite different. But to my surprise, the firmware already had a Prometheus endpoint built in!
Airgradient publishes itself on mDNS under the hostname airgradient_<ID>.local however, Prometheus service discovery doesn’t support mDNS yet. I gave the monitor a static IP and used the IP instead. The config and architecture looks much simpler now:
- job_name: airgradient
  static_configs:
  - targets: ['192.168.2.191']
    labels:
      sensor_location: living-room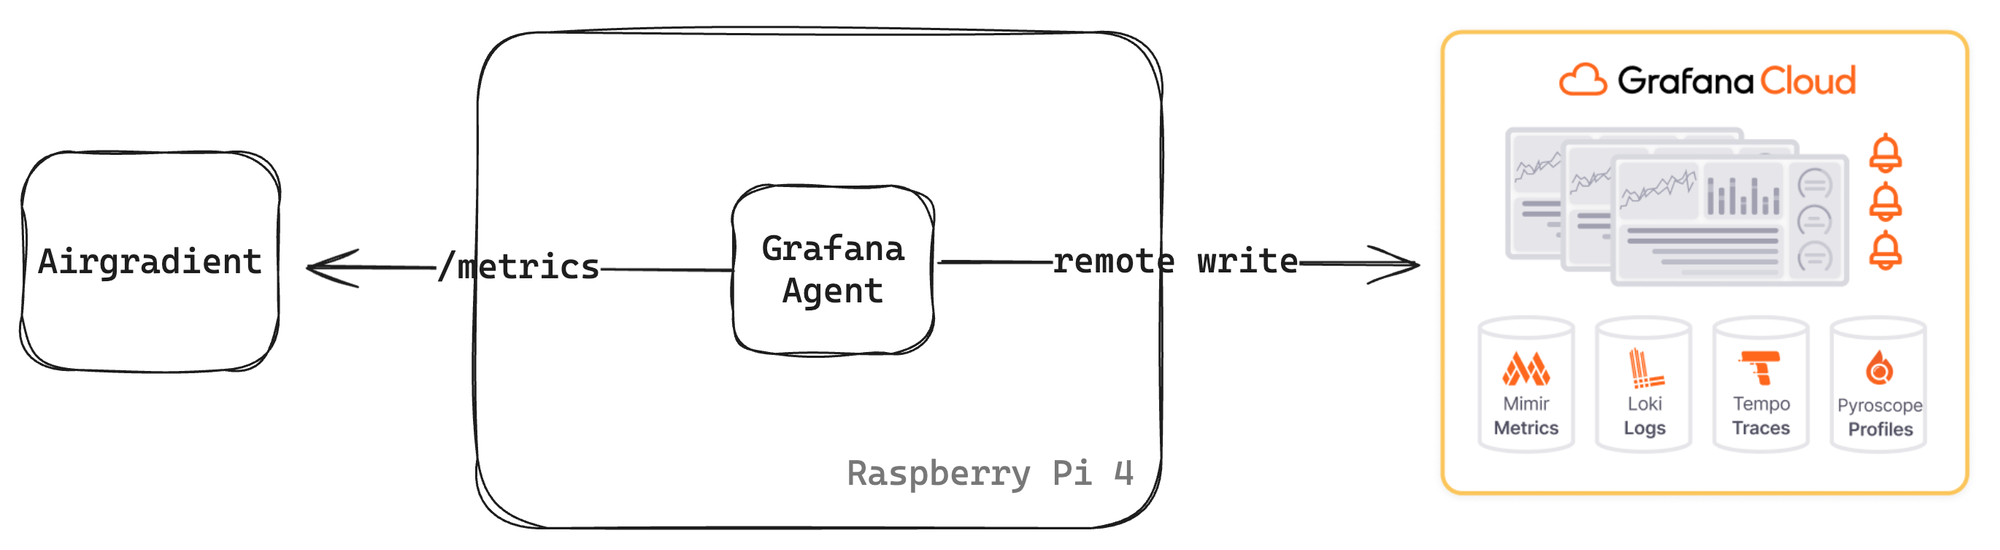
I had to make minor metric name adjustments to my dashboard and now I can see my home Air Quality metrics in Grafana too! I published the dashboard here. My dashboard requires a label called sensor_location to be specified as a target label (see config above). There is another community dashboard for Airgradient here that doesn't seem to have that requirement.
Next Steps
If you look at my office data, you can see the CO2 levels fall rapidly once in a while. This is due to me opening the window to let some fresh air in. I want to build a simple window open / closed sensor and add those events as annotations on the graphs.
I think a proper page for these events is too much, but I want to build a low disruption notification mechanism for when the quality gets worse.
And finally I want to make it easy to do mDNS service discovery in Prometheus.
Home Assistant integration
I’ve recently received an email from the Airgradient folks (achim.haug at airgradient.com) asking for help building a Home Assistant integration: https://forum.airgradient.com/t/are-you-a-home-assistant-developer/1800
If you’re a good fit, please reach out to Achim!
Member discussion