Lies, damned lies, and Elastic's benchmarks

It's a spicy title, but one that is warranted. Elastic recently published a blog post titled 30x faster than Prometheus, that claimed that Elastic's new TSDS timeseries engine is much better than Prometheus. When I started reading it, I was curious; maybe there are useful optimizations we can learn about. But very soon, I realized there were many things that were wrong.
For example, let's take this chart:
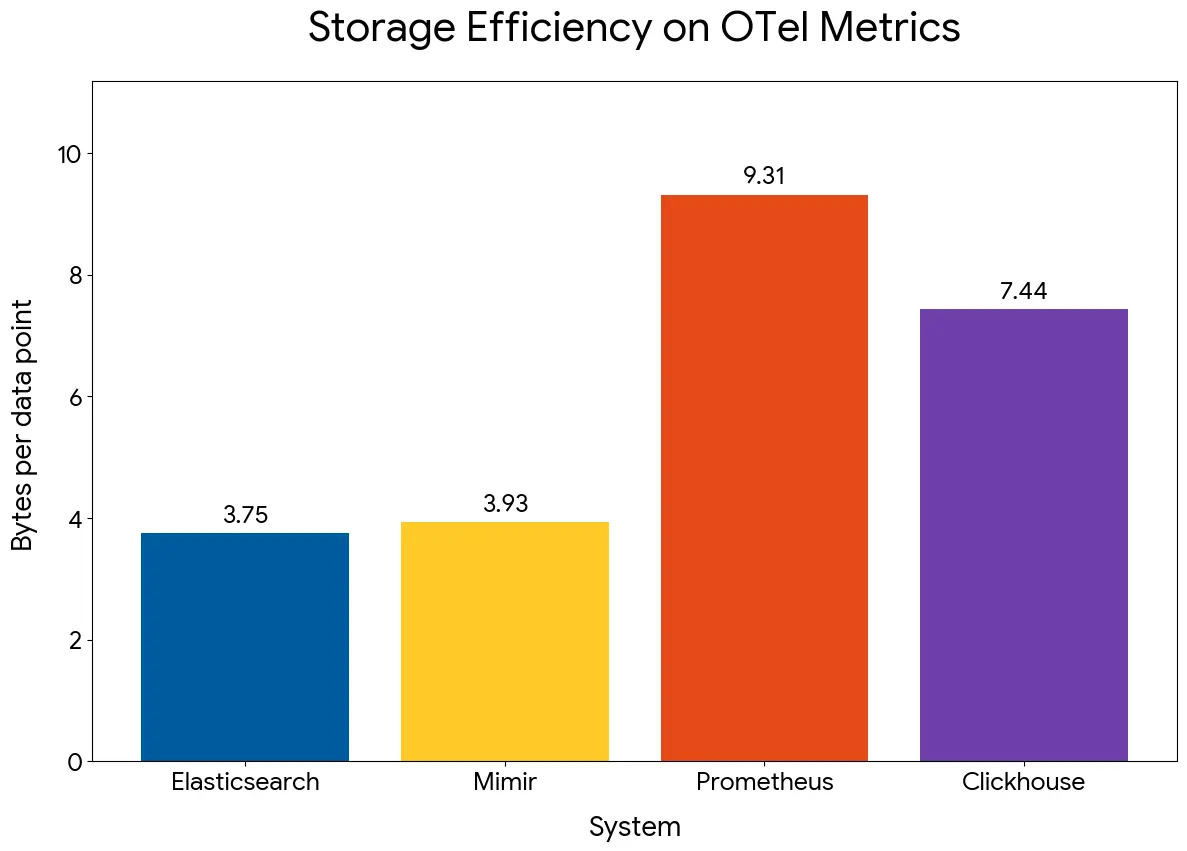
Prometheus should be closer to 1.5B per sample, from what I recall, so this was an immediate alarm bell in my head. But then Prometheus and Mimir use almost the same storage engine, so this drastic difference in storage space is just plain wrong. I could guess what was wrong, though; they probably ingested less than 2 hours of data, which meant all the data was sitting on the WAL with almost no compression.
So I wanted to understand how they ran the benchmark, only to find that the benchmarking code is not available 🤦♂️. The article mentioned using a metricsgenreceiver for this, but the harness was missing. They also made no mention of the CPU and memory being used in these benchmarks.
For all I know, Elastic and the JVM might be using twice as much memory and CPU for this! I was really annoyed at this point, so I decided to put together a quick harness out of spite. You can find it here: http://github.com/gouthamve/prom-elastic-benchmark
I ran it on my Mac with a 24-core CPU and 96GB RAM given to the Docker Desktop VM. Prometheus was ingesting 2.16 Million samples per second, taking roughly 8CPUs and 7GB RAM on average. The RAM spikes to 16GB during compactions. But the insertion finished in about 2 hours.
The storage space came out to be around 5B per sample. This is concerning, but, before I dug into why it was so high, I wanted to run the Elastic side of the benchmark.
Elastic struggled to ingest 😕
I was ingesting data using the following metricsgen config:
  metricsgen:
    start_time: "2026-05-08T00:00:00Z"
    end_time:   "2026-05-09T00:00:00Z"
    interval: 10s
    real_time: false
    exit_after_end: true
    exit_after_end_timeout: 10m
    seed: 123
    scenarios:
      - path: builtin/hostmetrics
        scale: 10000
However, this same metricsgen config errored out by default on Elasticsearch, and Claude had to increase the lookback period to 26h. I do not know the impact of this. Once we did that, the ingestion started timing out, and I don't think Elastic was built to ingest at a high samples/sec rate.
We tweaked the following:
⏺ Update(otelcol-es.yaml)
  ⎿  Added 9 lines, removed 4 lines
      20
      21  processors:
      22    batch:
      23 -    send_batch_size: 8192
      23 +    send_batch_size: 2048
      24      timeout: 1s
      25
      26  exporters:
     ...
      28      metrics_endpoint: http://localhost:9200/_otlp/v1/metrics
      29      compression: gzip
      30      encoding: proto
      31 -    timeout: 60s
      31 +    # 120s timeout: ES takes 30-90s under sustained load to ack big batches.
      32 +    # If we time out, we retry → ES returns 409 CONFLICT for the already-indexed
      33 +    # docs → otelcol marks them "dropped" but they're in ES → noisy + wasteful.
      34 +    timeout: 120s
      35      sending_queue:
      36        enabled: true
      34 -      num_consumers: 16
      35 -      queue_size: 100000
      37 +      # 4 consumers (was 16) — fewer parallel large batches reduces per-batch
      38 +      # ES latency, which is what was actually killing us.
      39 +      num_consumers: 4
      40 +      queue_size: 20000
      41        block_on_overflow: true
      42
      43  service:
And honestly, while the ingestion started out strong, it slowed to a crawl quickly. And would take more than 40 hours. I wanted to wait the 40 hours just to see how much compression they really achieved, but it started timing out again (with a 120s timeout!!). You can find the logs here: https://gist.github.com/gouthamve/e196962eac572b4d680fcb4aa234c67b#file-bench-es-logs
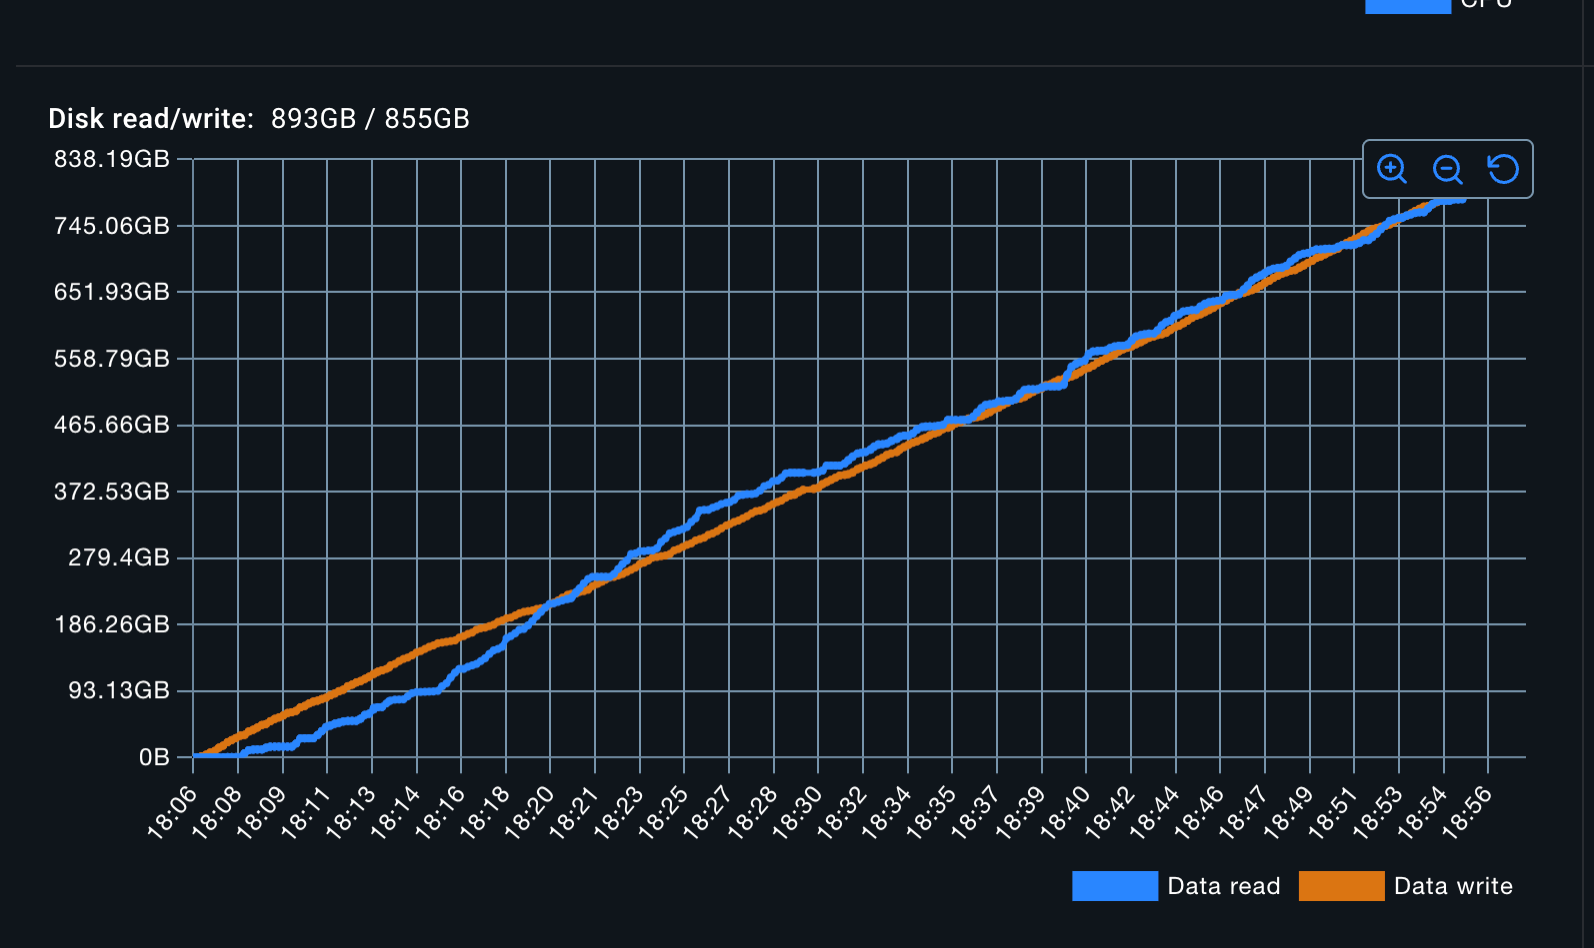
Furthermore, while doing all of this, Elastic is reading as much data as it's writing. I doubt that's good.
Talk to maintainers before you publish ANY benchmark
Does this mean Elastic is pretty garbage at ingesting data? NO.
Should I now claim that Prometheus is 20x faster than Elastic when ingesting data? NO!
This is a pretty artificial benchmark, and maybe it does pretty decently in the real world. I am also pretty sure it can be configured / tuned to perform better. And honestly, folks, you've done some pretty amazing work, some really cool optimizations, but you should have reached out to us before you went ahead and published your post.
Perhaps your query performance benchmark is actually good, but I cannot take it seriously at this point. Also, this is 2026; who publishes benchmarking results that cannot be reproduced?!?
We need a metrics benchmark
Someone pointed me to the article about JSONBench from ClickHouse. Honestly, we need something like this for observability metrics.
I also know that ClickBench exists. And when ClickHouse got into the Postgres game, they published PostgresBench. ClickHouse is getting into the Prometheus game, and maybe they'll create one :)
Member discussion