I built an AI SRE in 60mins, you should too
gcx, the CLI for accessing Grafana and Grafana Cloud resources was just announced at GrafanaCon. I had early access and was using it heavily. Claude can now query the logs, profiles, traces and alerts in Grafana Cloud. Unsurpisingly, Claude is excellent at leveraging it, and honestly, my visits to the Grafana UI decreased significantly! I was asking it questions around profiling and query optimizations and incident investigations. It was pretty good but it also went off the rails or got confused easily, so I had to guide it most of the time.
And then I came across this LinkedIn post by Sameer from Deductive AI, an AI SRE company. He had a point; I was using Claude heavily to do very similar investigations, but Claude wasn’t really learning these patterns.
Okay, so I picked a narrow scope and asked Claude what it takes to build a learning AI SRE. Something that becomes better after every incident. And in 60 minutes, I built a shockingly accurate AI SRE that gets better with each incident.
NOTE: While I am focusing on Claude Code and GCX, the learnings and approach can be applied to any decent harness and observability vendor.
The Faro SRE Skill
Most of my day-to-day work is on the backend of our frontend observability product. So I picked that as the scope. All the code and runbooks were already in the same repo, which made it simple. I just asked Claude what it would take to build an SRE agent that can leverage gcx and the runbooks to investigate alerts while also learning from incidents.
It suggested building a skill first before building a full-fledged agent, and we got started. It came up with this structure:
  .claude/skills/faro-sre/
  ├── SKILL.md                          # Main skill definition (methodologies, config)
  └── references/                       # Curated operational knowledge (gcx query mappings)
      ├── alert-playbooks.md            #   Alert-specific gcx queries & triage steps
      ├── cluster-topology.md           #   Cluster list, regions, cloud providers
      ├── faro-context.md               #   Dashboard URLs, SLO definitions, service context
      ├── recipes.md                    #   Reusable profiling/performance recipes
      └── release-runbook.md            #   Release monitoring steps & version tracking


  production/                           # Canonical docs (authoritative, skill defers to these)
  ├── playbooks.md                      #   Alert playbooks (Faro\* alerts)
  ├── architecture.md                   #   Service architecture overview
  ├── debugging.md                      #   Debugging queries & tooling
  ├── ops.md                            #   Operational procedures (kubectl access, etc.)
  ├── release_guide.md                  #   Release process documentation
  └── knowledge/                        #   Tribal knowledge base (learned from incidents)
      ├── README.md                     #   Knowledge base guidelines
      ├── incidents/                    #   Past incident write-ups
      │   └── TEMPLATE.md
      ├── quirks/                       #   Reusable patterns & region-specific quirks
      │   └── TEMPLATE.md
      └── proposals/                    #   Pending knowledge proposals (from investigations)
          └── TEMPLATE.md
I could now trigger it with prompts like:
Faro API - SLO Burn Rate Very High (prod-XX-XXXX-3, faro) fired at `Apr 10, 2026 11:40:47 (+00:00)`

Can you investigate it?

# OR I just got paged, can you see what caused that?
# OR Can you investigate alert ID: XV7HBS5JSDS
And it’s surprisingly effective. I had to do some steering to get to this state, though. Once the base skill was generated, I looked at all the alerts in the namespace for the past 2 weeks and investigated them. And after each investigation, it updated its skill to become more efficient and added things to the knowledge base and even updated the runbooks.
After it had 4-5 investigations under its belt, it got extremely effective and was usually spot on. It also started updating outdated runbooks to match the latest state. People started adopting it internally, and now it is how most of our team is troubleshooting. I am now working on helping other teams adopt this approach.
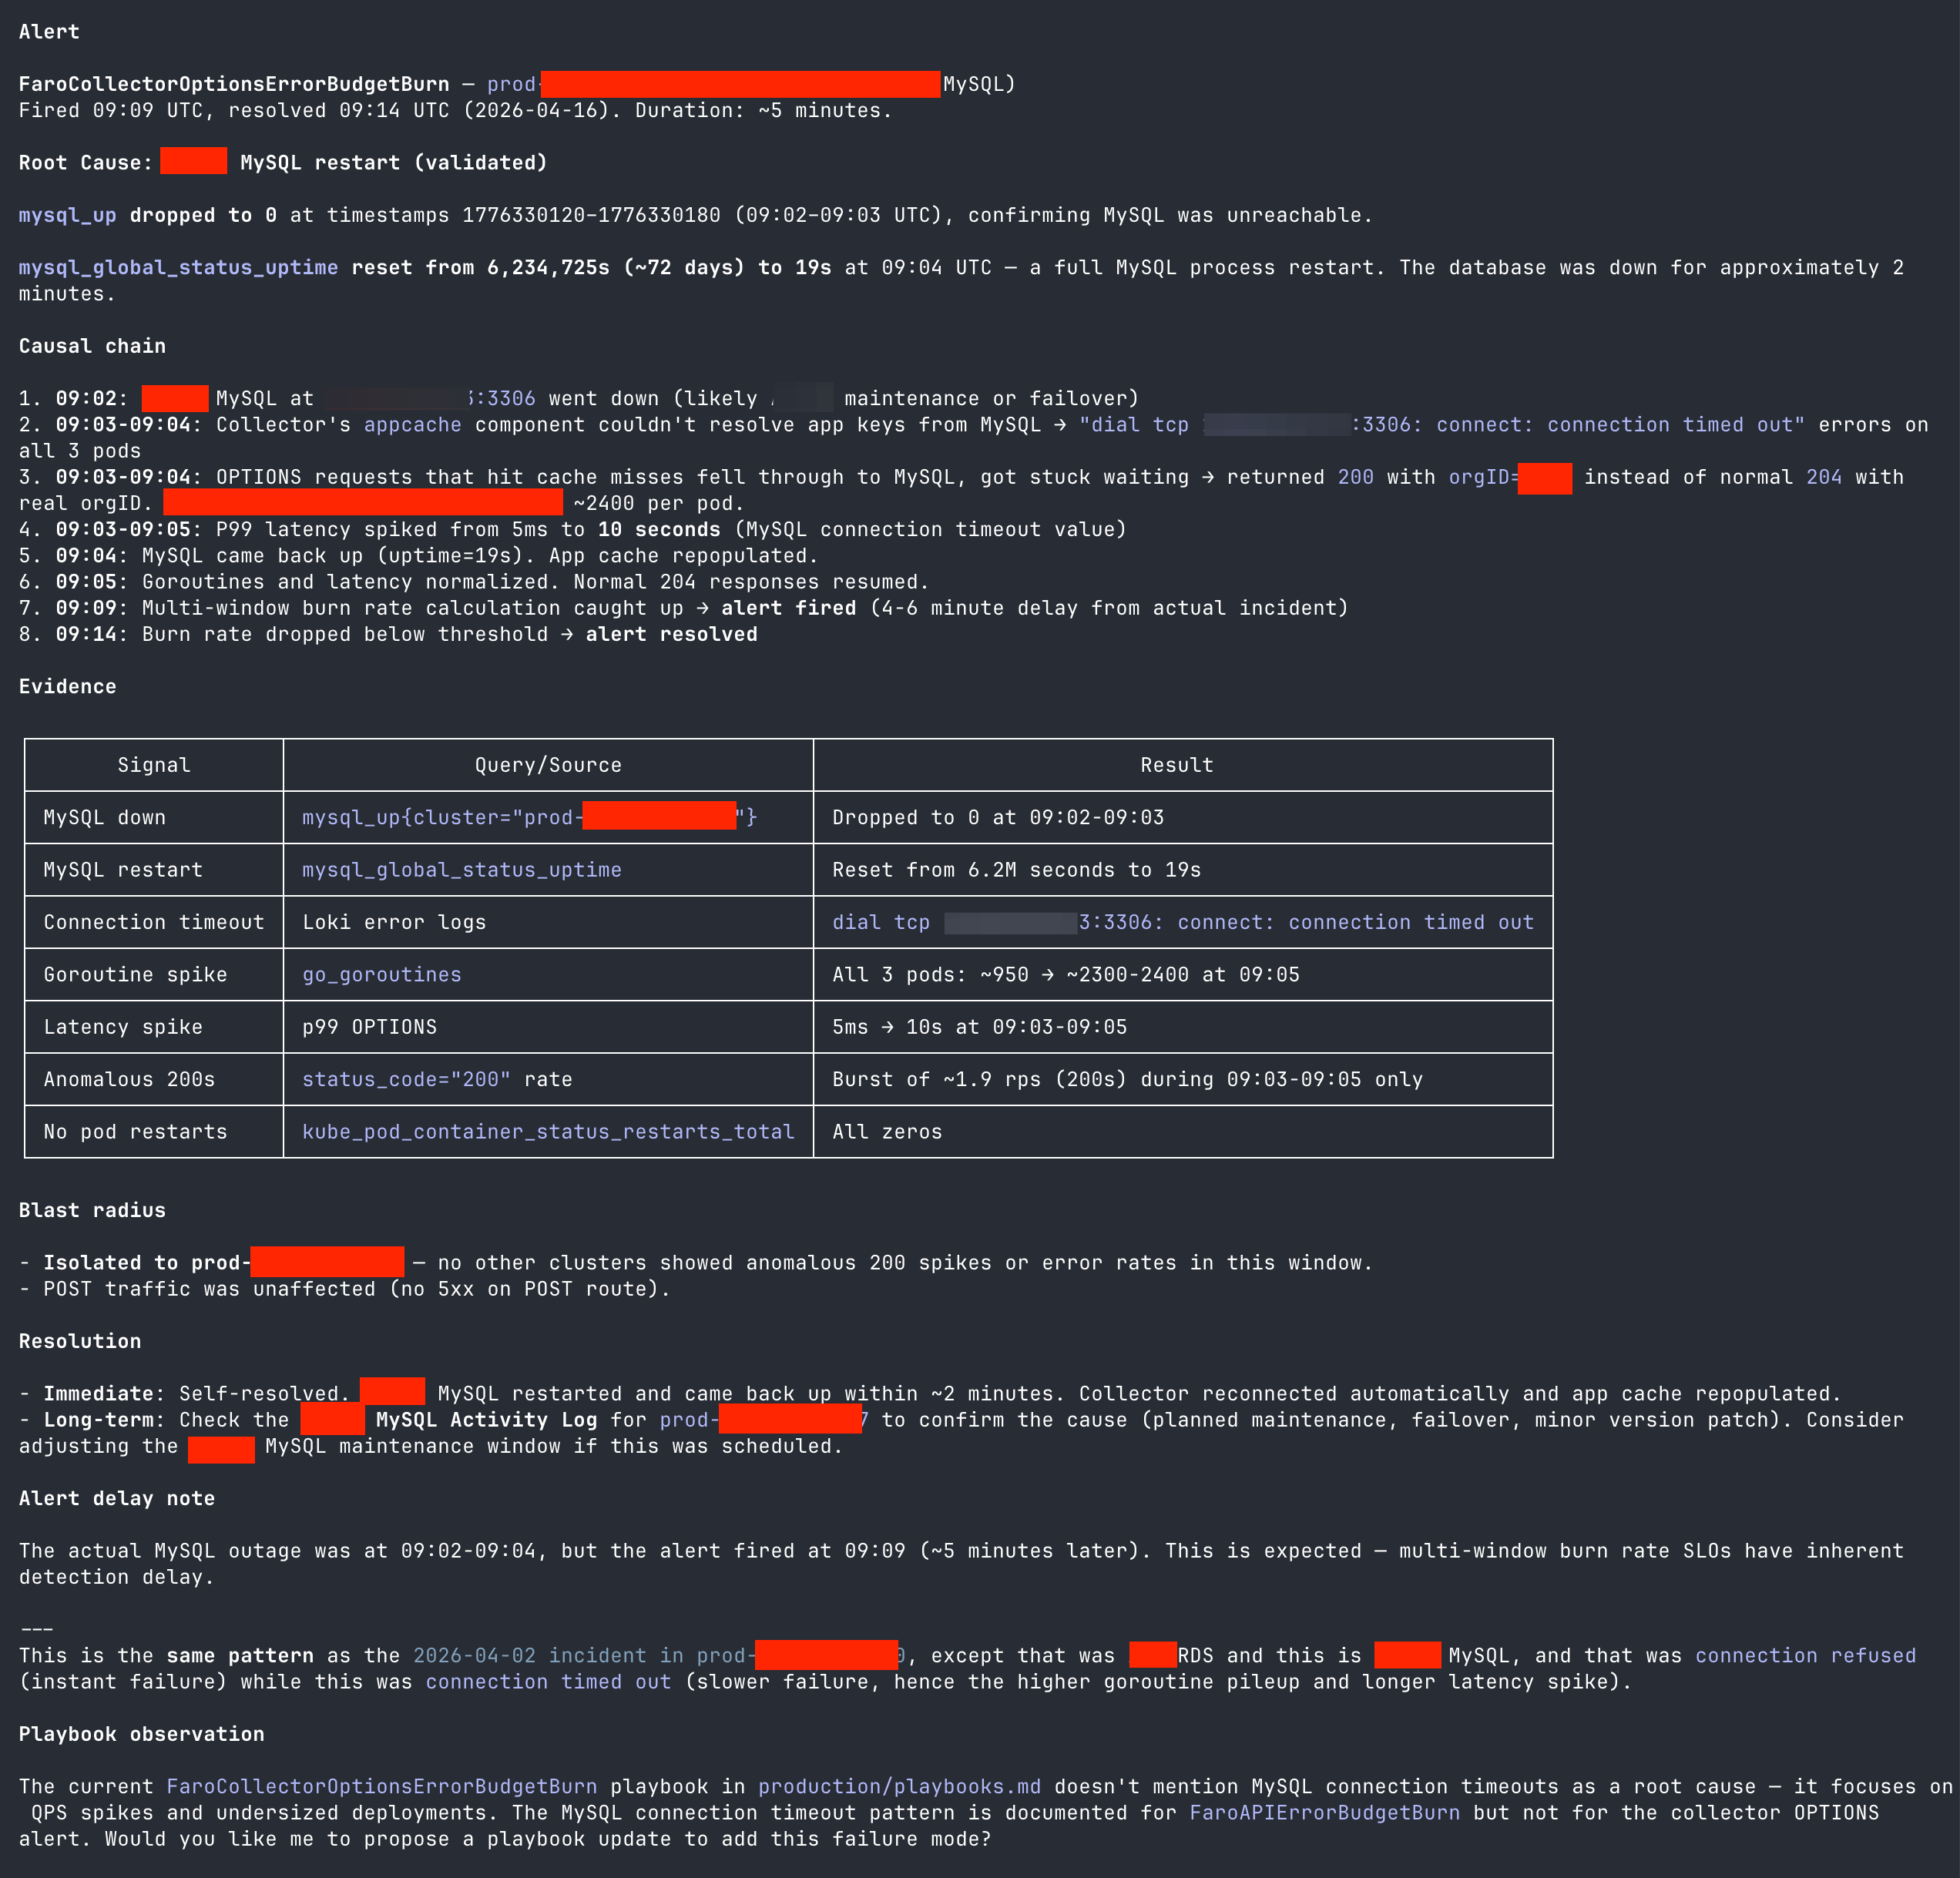
The output produced by the investigation looks like this:
Why this works so well
The backend system I am on call for is a simple one. It has a couple of services that talk to a MySQL database and process the request payload into the right formats before writing it to other downstream databases. The components are largely stateless, and there are only a handful of failure modes.
I also started by giving Claude access to the codebase. It used this and the telemetry available to build a dependency graph that persisted to memory. So when it sees a log line with an error relating to MySQL, it knows that it can query the mysql_* metrics in the same namespace.
I was in the driver's seat for the initial investigations. I manually picked all the pages we had in the past 2 weeks and investigated them with Claude one by one. I already had the PIRs and root causes for each of them, so I could point Claude at the right MySQL metrics and alerts to look at, for example. This helped it build a knowledge base that looks like this:
production/knowledge
├── incidents
│   ├── 2026-03-14-app-settings-deserialization-500.md
│   ├── 2026-03-18-hpa-thrashing-port-exhaustion.md
│   ├── 2026-03-26-writes-slo-otlp-gateway-502s.md
│   ├── 2026-03-30-REDACTED-dirty-state.md
│   ├── 2026-04-02-mysql-restart-connection-refused-REDACTED.md
│   ├── 2026-04-05-REDACTED-parts.md
│   ├── 2026-04-10-REDACTED-s3-ipv6-unreachable.md
│   ├── 2026-04-13-REDACTED-log-ttl.md
│   └── TEMPLATE.md
├── proposals
│   └── TEMPLATE.md
├── quirks
│   ├── 2026-03-28-low-traffic-slo-sensitivity.md
│   └── TEMPLATE.md
└── README.md
And now, after each incident, Claude either pattern matches it to an existing incident or finds a new root cause and opens a PR to update the knowledge base and runbooks. It also helps us build mitigations and update alerts to ensure things are less noisy.
I know this simplifies the problem statement, but this is honestly 95% of the services out there. And it works SHOCKINGLY well! I don’t have any evals, but the false positive rate is less than 10% now.
What’s missing from this “SRE”?
- It doesn't have good visibility into releases or changes yet, as all our deployment config sits in a different repo. While we have an insight for when a new version is deployed, we currently don’t have one for when a new manifest is deployed (maybe with a config update). We are working on getting sanitized manifests and diffs into the platform so Claude can leverage this knowledge.
- The boundary for the investigation is limited to the services I am on call for. If I get alerted because the Auth API is having issues, Claude just stops there and gives me the details for who’s on call for the Auth API and which channel to ping. This simplifies the scope, but ideally Claude can also investigate the downstream issues. It’ll be really cool to go to them with “The API is throwing 500s because it looks like the database is overwhelmed” vs. “The API is throwing 500s; could you please look into it?”
- Right now all of this is manually triggered. The Grafana Assistant can do automatic investigations and put a summary in the alert thread on Slack. I’d really like to hook it up to the Assistant, but Assistant has its memory in a vector DB. I like that with my “skill”-based approach, I can open PRs and get any new updates reviewed.
- Also, I need to find time to figure out how to hook all of this up, lol. It’s working well enough that motivation is a little low. 😄
Too good to be true? Try it yourself!
It literally took me an hour of chatting with Claude to both set up the base skill and build the initial corpus of incidents. It all started with this prompt:
I want to build an AI SRE agent that will help me troubleshoot incidents and help understand the telemetry. I want to build it on top of gcx (See @/Users/goutham/.claude/skills/gcx-investigative-tools/SKILL.md).

The speciality of this agent is that will be purpose built to handle only a small number of applications. These are the applications I am on-call for. I will continously update the knowledge base as more and more incidents happen.

The idea is that the SRE agent will handle (among other things):

* Any alerts down to their root-cause
* New release monitoring
* Profiling and improving the application

How should I go about building this? What frameworks, or tools should I use? @"general-purpose (agent)"
And once the base skill was set up, I just manually gave it each alert from the last 2 weeks, and after every investigation, Claude added things to the knowledge base.
Almost every single observability vendor out there has an MCP server or a CLI. So go give it a shot! I’d love to hear how it went for you!!
I understand why there are 50+ AI SRE startups
I am not kidding when I say there are 50+ companies. I keep finding new ones each week. Building a half decent AI SRE suddenly doesn’t look all that complicated to me. We just need:
- Access to the codebase
- Access to runbooks
- A memory system (files on disk are OK)
- Optionally, access to the Kubernetes manifests and changes there
I think it’s not that difficult to build a system that can connect to your GitHub and then build this context for each service. And it’ll even help you keep your runbooks up to date. I know I am extrapolating from a few services that have limited failure modes, but I think it covers 95%+ of the teams and their services, and it feels OK. This basic but decent AI SRE capability will become a platform feature for every observability vendor.
This also feels like a good project to build as open source. It’ll help others adopt OSS! I wrote about it in my previous blog. I foresee an OSS “Mimir SRE,” “ClickHouse SRE,” etc. that’ll help orgs run the OSS projects. If there is an OSS AI SRE, then we can crowdsource these knowledge bases. If the ClickHouse SRE sees a new failure mode, it can then open a PR to add it to the knowledge base (after stripping out all the proprietary info).
It’s exciting, but alas, it’s one of the 10 other exciting projects I want to do. And that is on top of an ever-growing backlog of things I need to do at $work.
There are a few projects out there that are trying to do this in OSS:
- HolmesGPT (CNCF Project, most open)
- IncidentFox
- OpenSRE
I haven’t evaluated them, but I am happy there are projects out there. Of course, we also have this as part of Grafana Assistant if you’re on Grafana Cloud already. :)
Assistant still has its place
This didn't mean that my usage of Grafana Assistant went away. I use it primarily in the UI. For example, just yesterday I was watching completion % for a long-running job creep up and asked it to modify the query to apply predict_linear and tell me when the job will finish. I also asked it to help me figure out why my Alloy config isn't working as expected.
The Assistant is excellent at explaining things, helping build dasboards and writing queries. But when it comes to incident troubleshooting, I somehow still prefer being close to the code. I am next to my IDE and can easily jump to the relevant code whenever claude comes up with a hypothesis.
Assistant can run also investigations autonomously and can attach a summary of the investigation right below the alert, I am looking forward to setting that up.
Member discussion