Tempo: A game of trade-offs
About 2 years ago, I wrote a long post about why we built Loki and the tradeoffs we made. Now, we've just launched Tempo, our tracing store, which I think takes a very unique approach to tracing. I've been raving about tracing for a while now, and I am personally a massive fan! Before I dive in, I have to say that both Annanay and Joe did an amazing job with Tempo given the short amount of time they had and I am completely blown away, just watching from the sidelines! Amazing job team! Read the official blog and how to get involved here: https://grafana.com/blog/2020/10/27/announcing-grafana-tempo-a-massively-scalable-distributed-tracing-system/
OMG the index!
But tracing is not without its problems, the chief of them is cost. Most of the cost comes down to the indexing issues. You have to run Jaeger, the leading open-source solution with either Cassandra or Elastic, both beasts of their own and extremely complex and costly to scale. The main reason to use them is because of the query and data patterns.
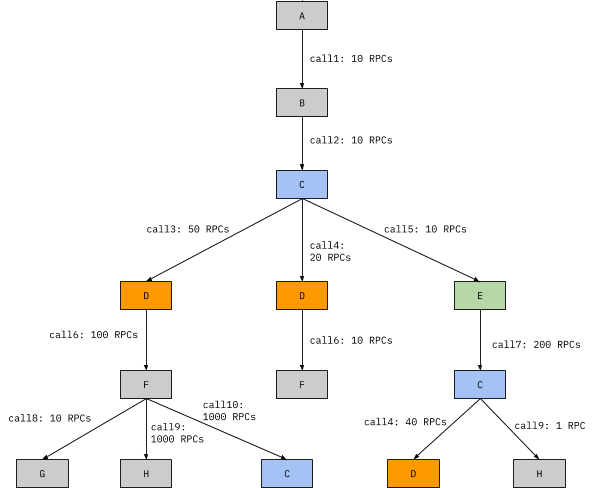
Traces have a varied datamodel, but fundamentally we track durations, and each of the object, called a span, we track has the following structure:
spanID → string
traceID → string
functionName → string

tags → map[string]string

startTime → time.Time
duration → time.Duration

parentSpan → string (is a spanID if it has a parent span, else “” to indicate rootSpan)
Now in Jaeger, we basically have to answer a few queries, first of them is give me all the spans for a particular traceID, i.e, something like:
SELECT spans WHERE traceID=XXXXOnce, we have all the spans, we can reconstruct the full trace to be something like:
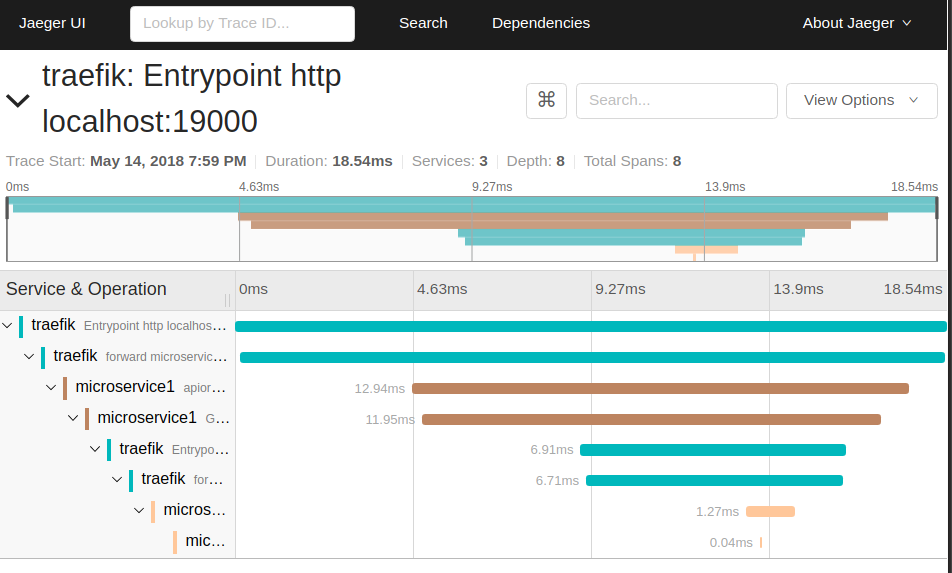
The second class of questions to answer is to select the traces matching a particular criteria, for example, give me all the traces emitted by the gateway for requests by user XXX on path `/home` that took more than `5s`.
SELECT unique(traceIDs)
LIMIT 1000 						[not-optional]
WHERE
tags(user=XXX and service=gateway and operation=/home)		[optional]
duration > 5s							[optional]
T1 < time.start < T2
Once we have all the traceIDs, we can use the query above to get all the spans for those traceIDs and we can get all the traces we want. Here in lies the problem, we need to lookup things on a set of arbitrary tags, and these tags are neither constant nor a predefined set.
Developers can and in most cases need to add 1000s of tags over the lifetime of the service, and each of these tags can have an insane cardinality, for example, the tags for userID or IPAddr have virtually infinite cardinality. To create a very efficient index is really hard, hence the dependency on Cassandra or Elasticsearch, but once you start using them, things start becoming expensive very quickly. One solution to the problem is to define a very strict set of tags with low cardinality, but the moment you start doing that you start losing out on a lot of the benefits of tracing.
Enter Tempo
So, I've played around with this problem before and I'm convinced that the best index for tracing is a columnar store, but hotdemn, there is not a single columnar store that is easy to operate, like Prometheus. The team went looking and realised the complexity and decided to break the problem into two parts:
Finding the relevant traceIDs
Our biggest use case for tracing is to debug query and request performance and we realised most of our queries are of the form, give me all the traceIDs from this namespace, for this user that took longer than 5s. And tbh, the Jaeger querying didn't really work for us so we did the next best thing, we printed out the traceID in the request logs and then generated a daily report!
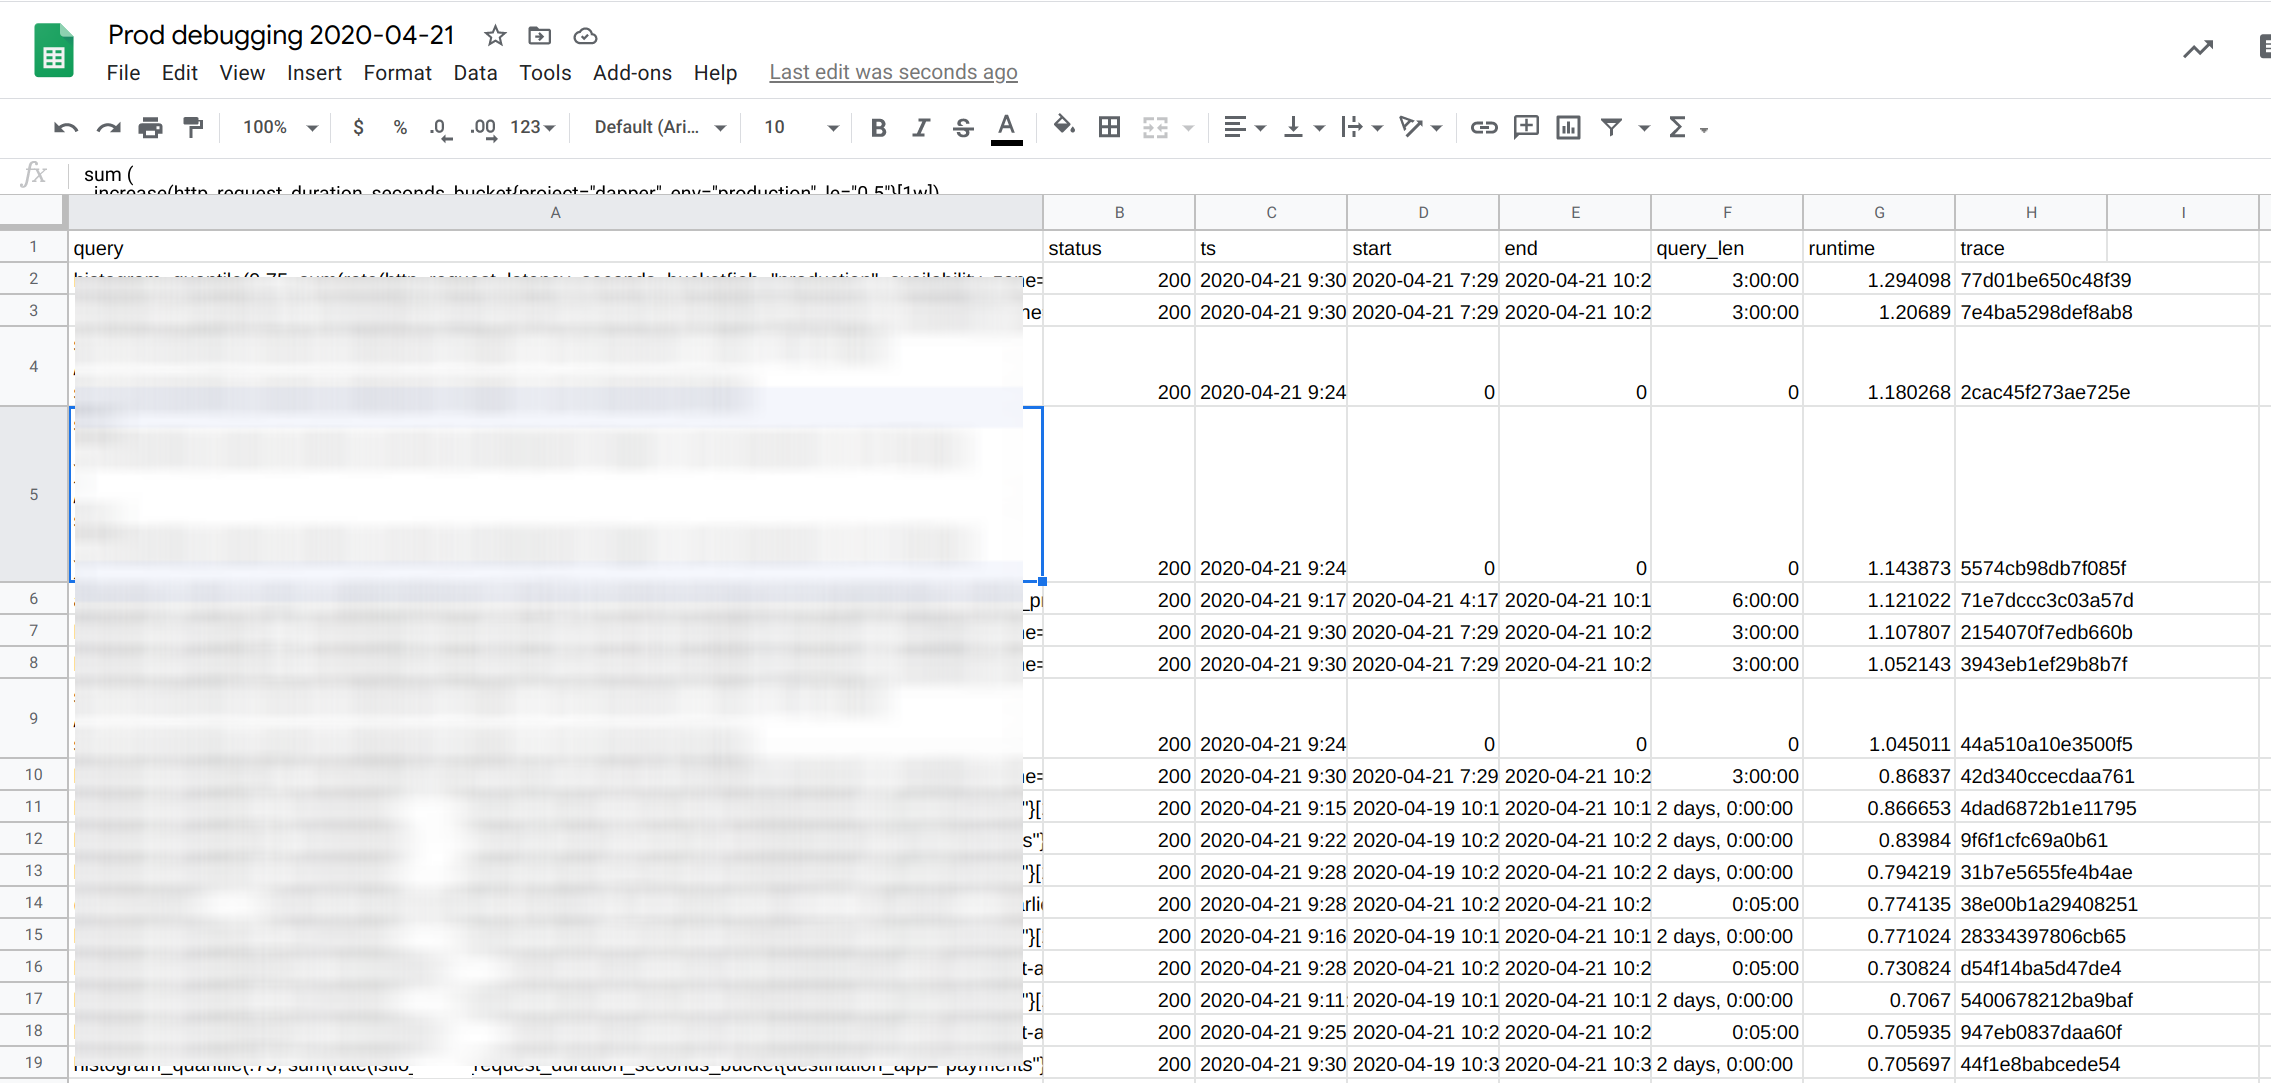
We basically traced and stored all the read path requests and then from this report, we picked the slowest queries and looked them up in Jaeger. This worked wonders, but over time, as our query load grew, we had to switch on sampling and could only store 50% of our queries. This meant when I was looking at a particularly interesting query, there is only a 50% chance I could look it up. Less than ideal, but we could live with it (for the short term ;)). We were using Loki to retrieve the logs and then had custom logic to generate this report but now with Loki v2.0, you can basically use LogQL to generate all the info in the report above!
As we started to explore how a new tracing solution would look like, we realised that we could offload the discovery of traceIDs to logs and metrics. For logs, the report above is enough, and in general we can figure out which traces are interesting by looking at the request logs.
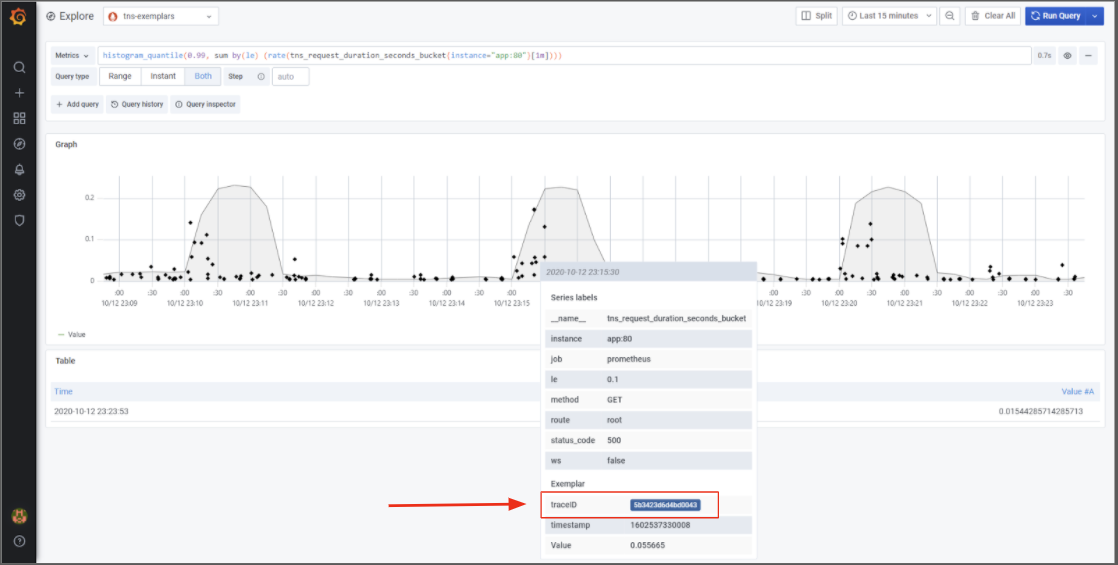
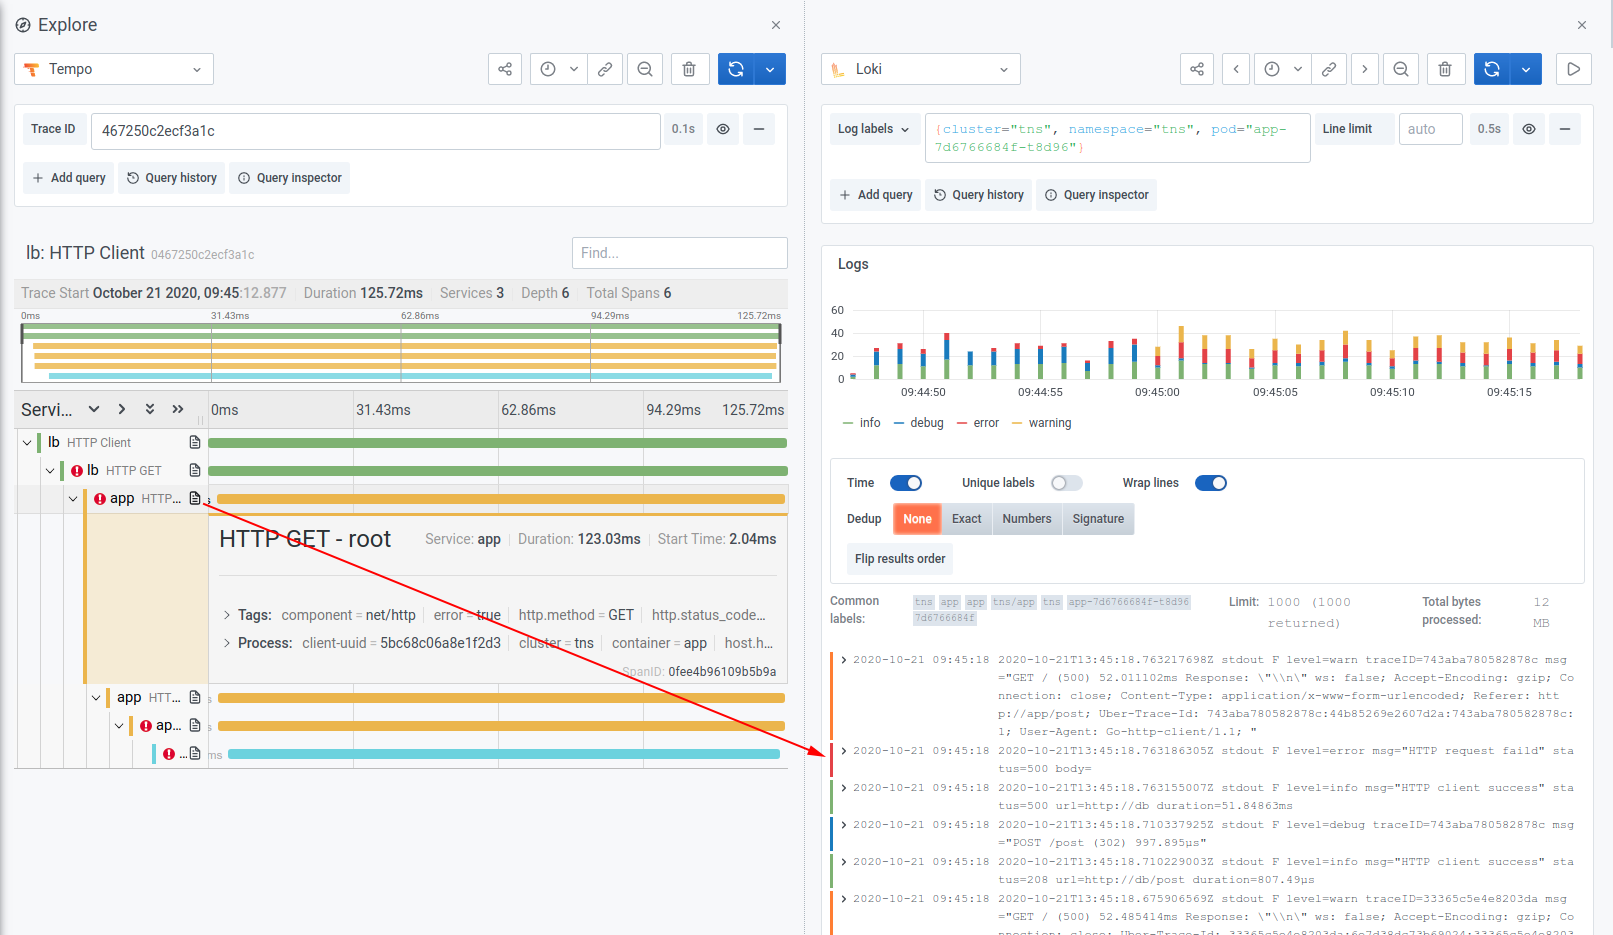
For metrics, we slowly started the work of adding exemplars into Prometheus, so that we can basically jump to a trace from a graph. A good example is the screenshot above. This is with an experimental version (open PR) of Prometheus, you can see that the spikes in latency are only due to the very short spike (at the beginning) and the graph is over 1m, because of the rate[1m]. This is super interesting information already, but the killer feature is that you can click on a dot to jump to the trace for that latency!
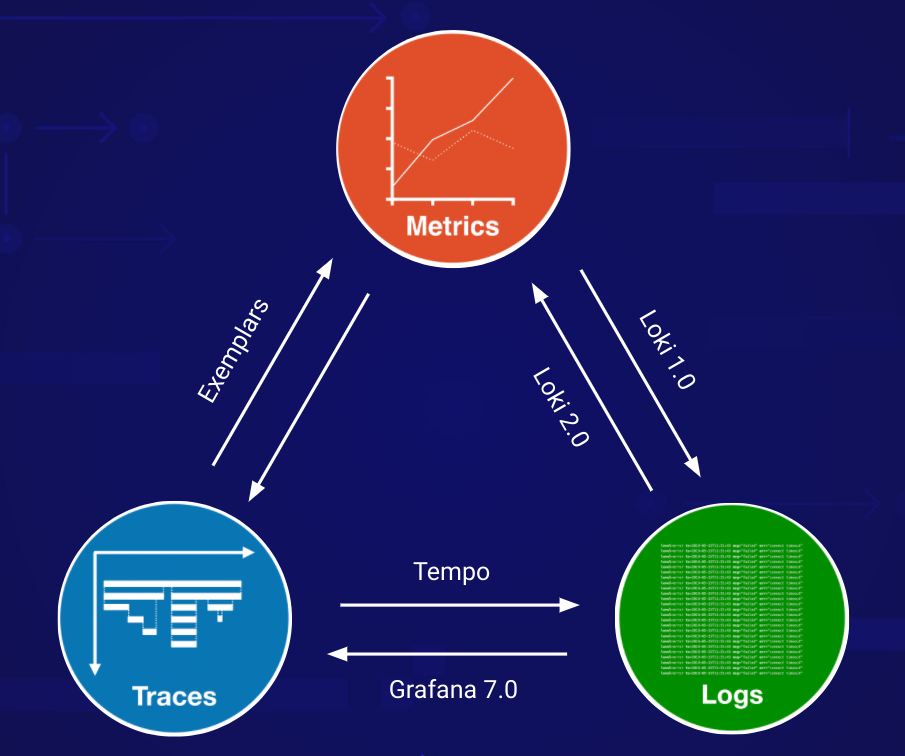
We've been touting this holy grail of jumping between metrics, logs and traces for a while now and we decided for the first version, not having an index and powering all the lookups through Loki and Prometheus might be enough. It's an interesting experiment to run tbh, and it works quite well for us. We just have to see how others react to it, it takes a lot of discipline. You need to print traceIDs in your logs and expose exemplars in your applications and nothing in this workflow is commonplace.
TempoDB: The KV store over Object Store
Okay cool, we kinda sorta circumvented the problem of finding the right traceIDs, we still needed to figure out how to lookup the traces given a traceID. Now tracing is no small beast, you need to store a lot of information. For every single request, we need to store all the RPC calls, and the tags associated with each RPC call (namespace, pod, service, endpoint, function, etc.) atleast but the power of tracing is truly unlocked when you start instrumenting specific functions you're curious about and various other metadata.
This means for about 1K QPS (our query load), we're writing 170K spans/sec and and 40MB/s of data. This is insane, with a week of retention its 24TB of data! Now, not a lot of storage systems can handle that load and even if they can, they're a pain to manage and build.
Going back a little, that amount of data is not new to us. We run our hosted Prometheus solution on top of Cortex, which manages several hundred TB on top of Bigtable. Cortex also supports Cassandra, DynamoDB, but one problem ails all these systems: They're hard to manage and expensive to run! Thanos, another project that does long term storage for Prometheus, uses Object Storage like S3, GCS, Minio, etc. to store data. It saw a lot of adoption, even with the existence of a more mature Cortex project, and a large part of the credit goes to using Object Storage which reduces the TCO by an order of magnitude and makes the system overall much easier to use.
We've learnt from Thanos and made sure Loki could run purely off of object storage and made it super easy to use and we saw incredible success! At this point it was clear that if we wanted to build a scalable, robust but inexpensive tracing solution, we needed to build it on top of Object Storage. To put it in perspective, storing 24TB in GCS costs less than $500 per month! This is great, and now Cortex's new storage engine borrows from Thanos and is fully backed by an Object Store and easy to use as well!
With that decision, we needed to see what the datamodel looks like and we quickly realised that all we needed was a KV Store built on top of Object Storage. Literally the query model is to load all the spans for a traceID. Hence a KV store where the key is the traceID and the value is the blob of spans for that traceID. Now, a trace object (the collection of spans) is super small in the order of bytes to a few KB hence using the traceID as the key in the object store won't work, atleast not cost efficiently. We need much bigger objects for this to work.
Enter tempodb, our KV store built on top of Object Store. tempodb collects the KV objects and builds them into large blocks, several 100MBs big and stores them in an object store. It has a lot of cool magic inside including bloom filters and compactions and I'll dive into it in its own blogpost.
TempoDB is not Tempo!
But a simple KV store won't cut it. When applications send us data, they will end up sending us individual spans, and not all the spans bunched together by traceID. We needed a system that could collect all the spans together, assemble them by traceID and store them in the Object Store. Basically we need to collect spans by the traceID and fortunately we have a lot of experience with this problem in Cortex (and Loki) where we needed to assemble all the samples by their metric for compression. It's a very robust and scalable system that uses a hash ring and we used the same system for Tempo. This guarantees us virtually infinite scalability!
Our docs are sparse now (we're working on them pronto!) but you can get some of the details here: https://grafana.com/docs/tempo/latest/architecture/.
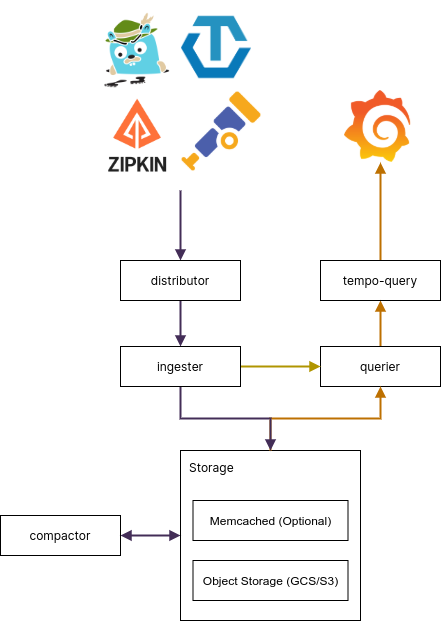
I'll explain this in detail with the tempodb blogpost but the gist is, tempodb is a generic KV db built on top of an object store backend. In Tempo, we use it to index the high cardinality traceID field.
Now Tempo is not just the simple storage layer, but also does sampling if required and enforces retention and we are going to add more tracing specific features to it.
TLDR?
Overall, I can say this about Tempo, it's a simple but scalable, easy to run and inexpensive tracing store that relies on other systems for its indexing. I'm using indexing loosely here, but you get the point.
The future is bright and BUSY
We're nowhere close to done here! I think we have done a lot of amazing work and have something that we're relying on in production every single day. But we have a lot more on its way.
Make Logs and Metrics driven lookups mainstream
We, as in engineers at Grafana Labs, use Logs to drive the trace lookups. I think this is super unique to us and we need to make sure that it's easy to print out traceIDs in logs and also that people using Elastic, Loki and every other logging system can quickly switch to traces from their logs.
Exemplars shared above are just a demo for now. We have a branch of Prometheus which supports exemplars, and the exposition format and the Golang client library now supports them, but we need to make sure that we add this to Prometheus proper and that all the client libraries support exposing exemplars. Once that is done we should refine the metrics to traces workflow in Grafana so that other metric stores also support them and exemplars are mainstream.
Make Tempo better and grow the community
Tempo today is just Beta software. True, we have been using it in production for months now, but thats just us! I'm super excited to see how the community starts using it, the problems they'll run into and just to generally see the community grow and for Tempo to hit 1.0!
Build that analytics columnar store!
I think offloading the lookups to logs and metrics is great but this involves visiting 2 systems. Sometimes I just want to look at traces directly and I should be able to do the lookups directly in Tempo! But thats not the only usecase, tracing in its current form is limited and it has been written up in several excellent posts:
 Cindy Sridharan
We don't just want to lookup the trace but run analytics on the traces to get a lot more info, for example:
SELECT histogram_distribution(span.duration) WHERE
	tags(user=XXX and service=ingester and operation=push)
	T1 < time.start < T2
To do analytics like this, a columnar store is perfect, but I couldn't find a good one that is backed by an object store, schemaless and super simple to operate. I pray I am wrong and that there exists one already, because that would be awesome!
I should give a shoutout to sybil, but its sadly not embeddable and uses a forked process for everything. Nothing wrong with that in itself, but it also has very little activity and the code is far from idiomatic. Honeycomb is a great solution and is powered by such a columnar store and Slack uses Honeycomb for its trace indexing! But sadly it's closed source and I think (heavy emphasis on I) we will end up building an OSS columnar store as part of Tempo 2.0.


Member discussion